Dr. Paul Carter, President and CEO of GWS comments:
“Adapt, React, Readapt, Act.” Is the wireless industry following Michael Scott’s second rule of business? While it may be a stretch to compare what’s happening with mobile and broadband operators to an episode of The Office, we do see the industry shifting to present more attractive solutions to consumers. Market and service consolidation, network transitioning – it’s all happening. In this year’s analysis, we looked not only at mobile and broadband performance on their own but also dug a layer deeper to look at the combined connectivity experience of broadband and mobile services. We wanted to get the full picture as it relates to network performance vs. consumer expectations vs. consumer behavior.
When it comes to mobile networks, T-Mobile is doing what T-Mobile does – providing a network that operates at full throttle. In our tests, they are a clear winner when it comes to the best mobile experience. Their sprint to build out an advanced network is making a difference. In fact, they also have the top performing 5G network and they’ve got their customers hooked – our polling shows that nearly half of T-Mobile’s customers (47%) say it’s important to have 5G signal wherever they are (which is up 7% on the national average). Will T-Mobile’s trajectory continue – what will be the impact on their rankings if their acquisition of US Cellular is approved? They’ll get an additional 4 million customers and wider reach in rural areas but will it help or hinder their overall network performance? Stay tuned.
Moving on to the best broadband experience, Verizon comes out on top of the pack with a solid performance across all metrics tested. This is the case both when we include data from Frontier, which Verizon acquired earlier this month (pending regulatory and shareholder approval), and when we test Verizon’s current performance without Frontier. Not far behind Verizon in the rankings is Xfinity – and interestingly, Xfinity performs best when it comes to meeting the newly updated FCC speed benchmark for broadband. How relevant is this? Very. Our data shows that households have multiple users online at any given time, and over a dozen devices connecting to WiFi throughout the day – from phones to laptops to smart TVs and appliances and much more. This means that shared bandwidth has become critical to a household’s broadband experience, which is why we factored the FCC benchmark into our measurements and scoring.
Finally, we looked at the best combined connectivity experience for consolidated service packages (bundle deals) as our polling shows a strong interest from US consumers in plans from operators that provide both mobile and broadband services (over half of Americans look at bundle deals when assessing their next choice of broadband or mobile provider). When analyzing the test data from consumers using networks on these partnered mobile and broadband packages, AT&T is a clear winner with a solid performance across areas like reliability and speed – great for those who just want to be on one network for all services.
The world today is more connected than ever before. We’re now spending nearly a third of our waking day on smartphones, and the data shows this trend is only increasing. It’s never been more critical that networks are delivering for their consumers – consumers who pay attention and have definite performance expectations. After all, when we’re so reliant on our devices, it’s the network that delivers the best experience that’s the most attractive – something that is front of mind for consumers when considering a new network. Maybe Michael Scott’s advice isn’t so far off after all.”


Consumer usage of mobile networks
GWS test data shows that Americans spend nearly one-third of their waking day on their smartphones, with 28% of that time spent on mobile networks and 72% spent on WiFi networks. Regardless of the time spent, mobile access remains vitally important, especially when looking at what people are doing on those devices, which is focused on communication, navigation, and social media; all of which play an important role in the daily life of a consumer. GWS analytics data shows that people spend over 50% of their time on just 10 mobile apps, with Facebook at the top, followed by YouTube, Chrome Browser, TikTok, Google Maps, Facebook Messenger, Instagram, Google Messages, Snapchat, and Gmail. In addition, when surveyed consumers chose messaging/texting as their single most important phone function when asked to pick just one.
What concerns people when they’re mobile: reliable coverage and speed. When polling users about factors that would make them change mobile operators, poor coverage and dead spots, and slow network speeds were two of the top three reasons (an expensive plan was the other). GWS also found that more US consumers than not are seeing a tangible impact from advanced network connectivity – when asked about thoughts on 5G, just 19% of consumers felt they were unable to tell if their performance was better or not when on 5G. However, for T-Mobile-only customers, their 5G experience appears more notable as nearly half (47%) say it’s important that they have 5G wherever they are.
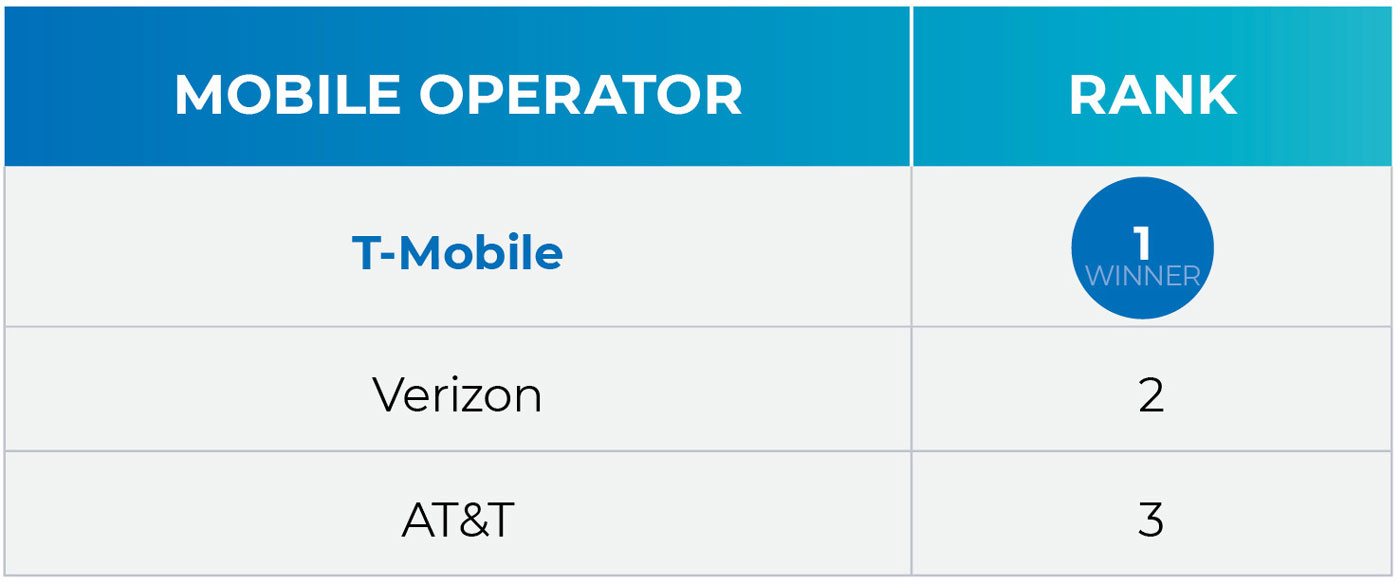
Performance metrics measured: reliability, latency, upload and download network available throughputs, delivered throughputs, and packet loss.
Test Results: T-Mobile performed at the top in categories such as average network available throughputs, with download speeds at nearly 170Mbps and upload at 20Mbps; nearly double the download speed of the next nearest operator (AT&T at 86Mbps).
When looking at mean download throughput rankings, T-Mobile scores top, followed by AT&T in second place and Verizon in third. When looking at mean upload throughput rankings, again T-Mobile scores top, followed by AT&T then Verizon.
Task reliability across the board was consistent; above 98% for all three operators.
Note: when looking at only 5G, T-Mobile demonstrated the best 5G mobile experience as it had the highest available throughput speeds, lowest latency, and lowest packet loss.
The state of broadband in US homes
Broadband performance is central to our lives online – nearly three-quarters (72%) of the time we spend connected using our smartphones is via WiFi networks. But it’s not just about how people are accessing the internet – it’s also important to consider what are they doing and on which devices. GWS polling data reveals that people have between 13 and 14 connected devices running on home broadband networks, which collectively increases the throughputs required to run them all simultaneously. Looking at mobile devices specifically (smartphones and tablets), households typically have at least three connected via their WiFi/broadband network. But as well as this, game consoles, smart TVs, smart audio devices and speakers, smart home appliances, and security devices are all running off home WiFi networks (see table below). What’s more, over half of all households say that the majority of members in their house are using the WiFi simultaneously for more than 6 hours a day, showing the importance of stable and fast broadband connections for work and play. Added to this, 69% of those surveyed said they would change ISPs if their network speeds were lower than published, so it appears that fast and reliable connectivity is a must for long-term customer loyalty.
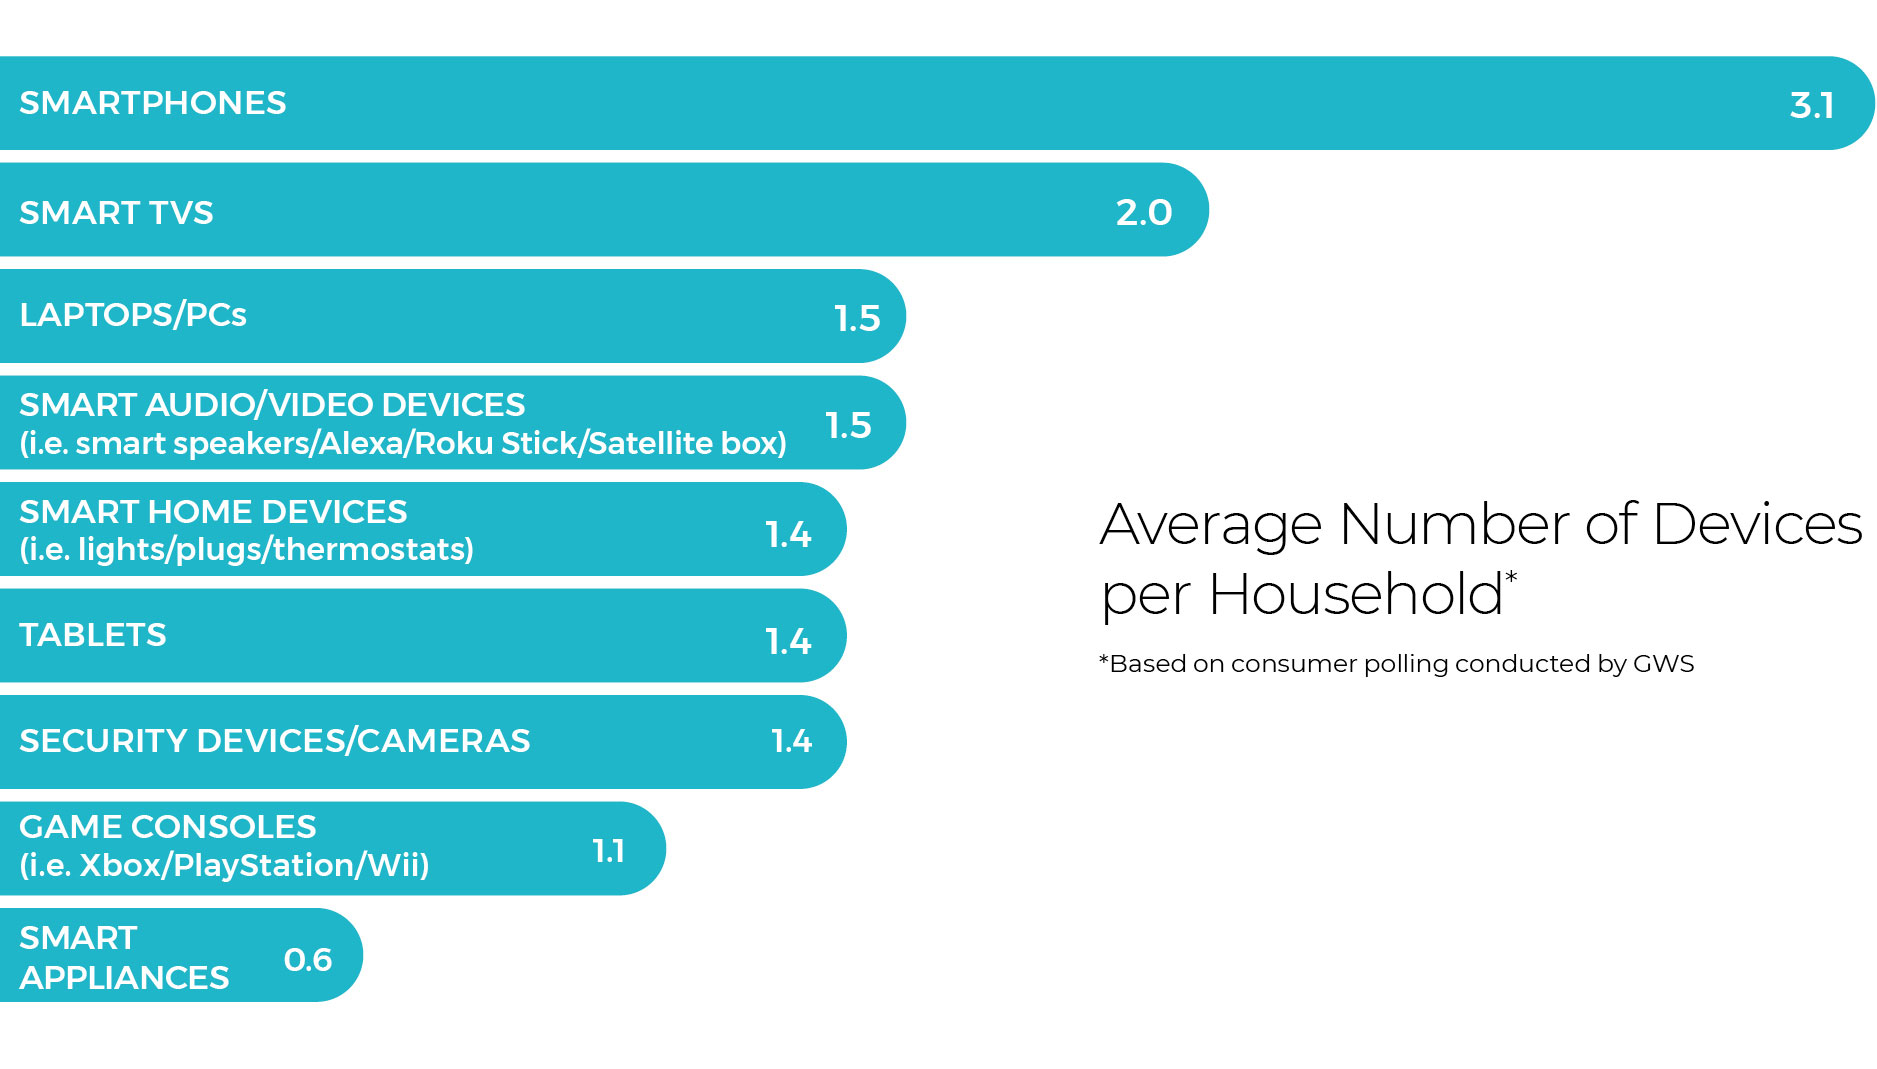
When factoring in the number of connected wireless devices at home, the average throughput requirement for a US resident is therefore much higher than when a person connects to a mobile network using just their smart device, which is a performance aspect that needs to be considered when assessing ISPs. This is one of the reasons why the FCC announced in March 2024 an updated baseline throughput standard of 100Mpbs for downloads and 20 Mbps for uploads – further details on how the networks are performing against this are provided below.
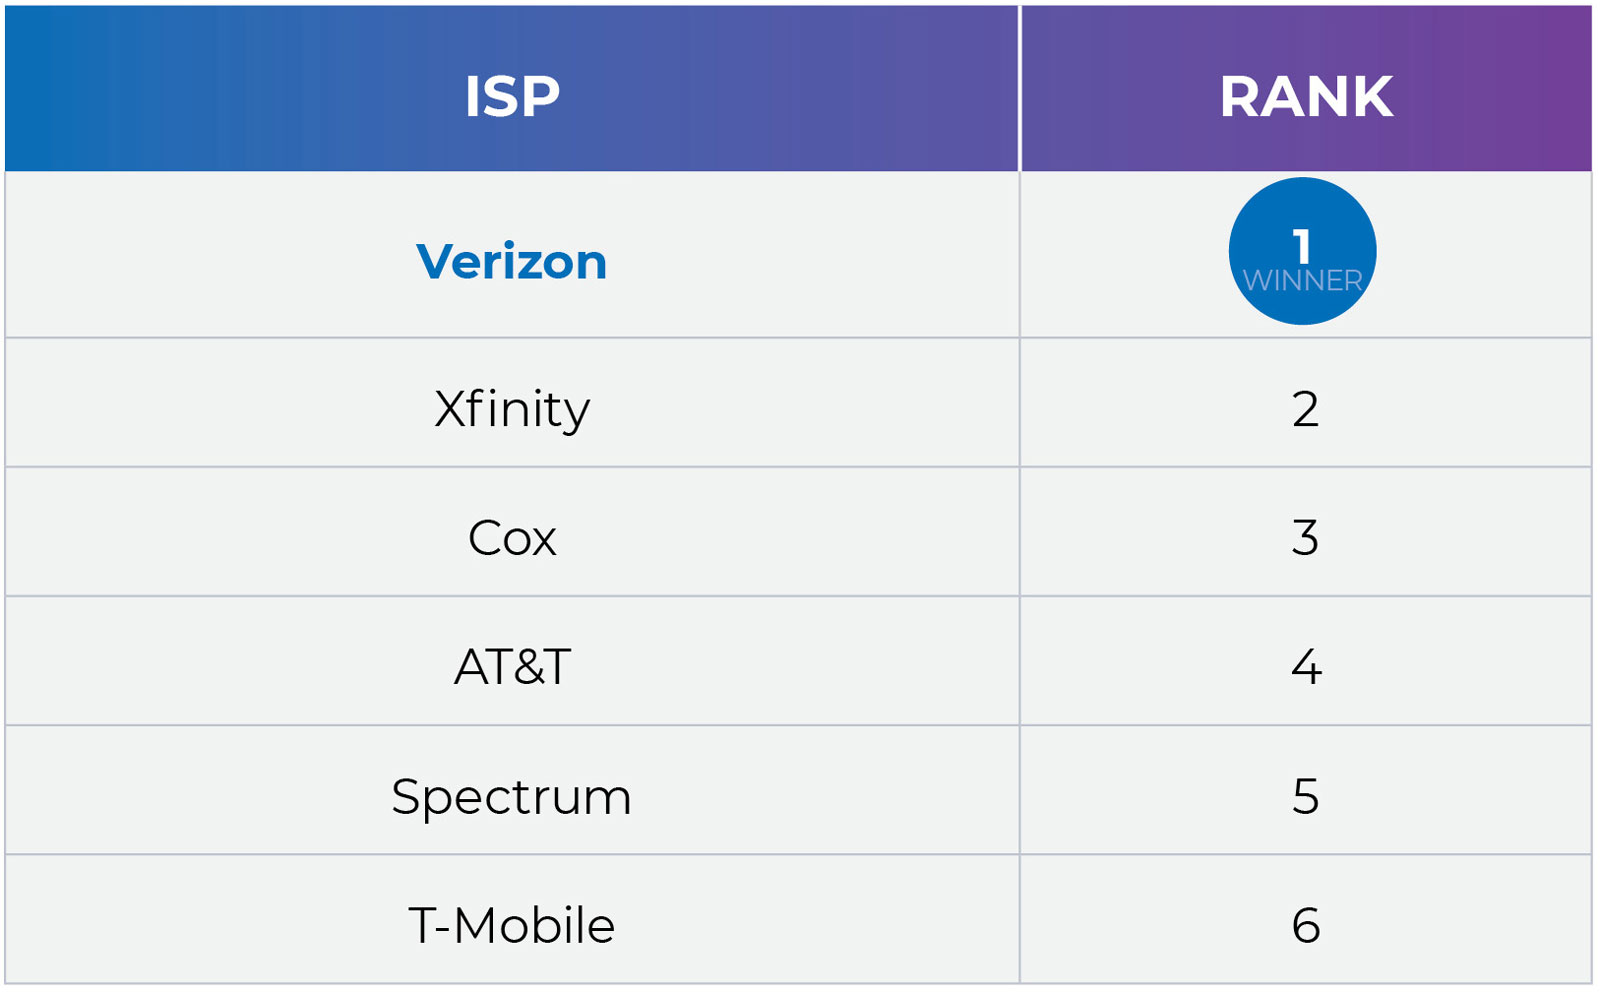
Performance metrics measured: reliability, latency, upload and download network available throughputs, FCC broadband benchmark, delivered throughputs, and packet loss.
Test highlights: Verizon led the pack when it came to its overall broadband performance, with a solid performance across all metrics. Verizon, Xfinity, Cox, and Spectrum all had mean download throughputs above 150Mbps. On the flip side, Cox and Spectrum had much slower upload speeds (both below 40Mbps) when compared to Verizon and AT&T (both above 90Mbps). ISPs tested were similar when it came to task reliability, with each scoring near or just over 99%.
It’s also important to note that Xfinity came out on top for the percentage of time that their consumers experienced speeds over the FCC broadband benchmark. The data shows that Xfinity consumers exceed this benchmark 41% of the time (average across all ISPs was 33%). When looking at the inverse of this statistic, it suggests that reaching this benchmark consistently may prove challenging for the broadband industry, as two-thirds of the time study participants did not experience throughputs above the benchmark when tested.
The rise of bundled packages and the need for a combined mobile and ISP score: For the final award, GWS analyzed the performance of partner network bundles across ISP and mobile and found AT&T to have the Best Combined Connectivity Experience. This is important because of the rise in bundle packages – recent GWS data found that over half (52%) of US consumers consider bundle packages when selecting a mobile or internet service provider.
Further, the desire to switch to a better bundle deal is one of the top three reasons why consumers would look to change their ISP.
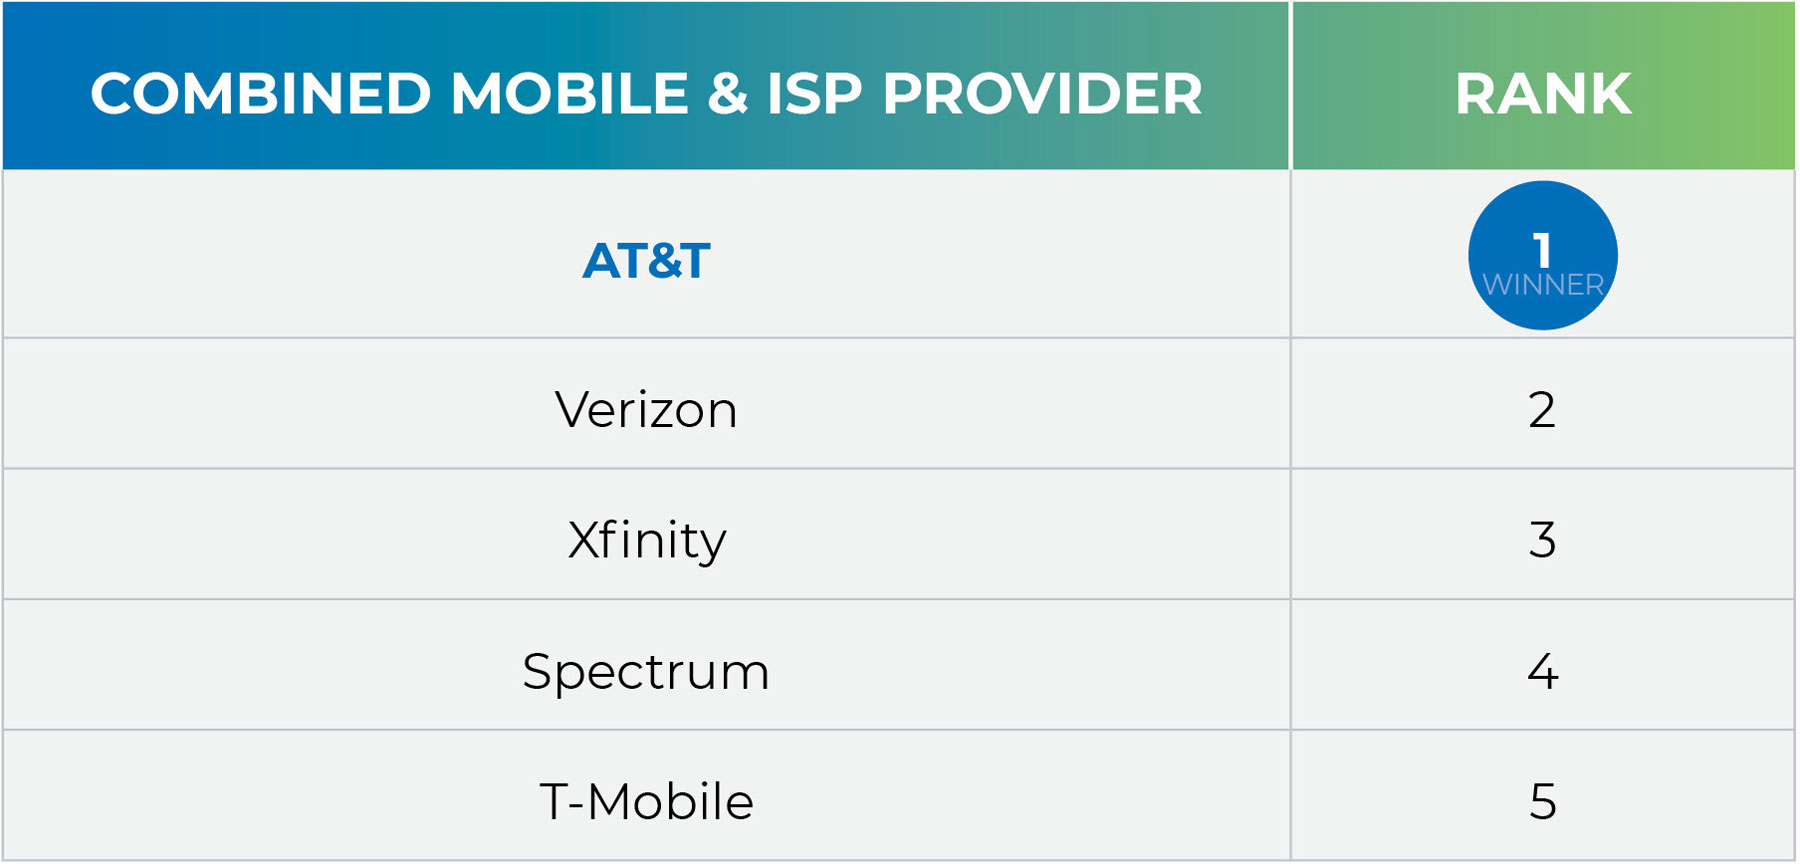
Performance metrics measured: reliability, latency, upload and download network available throughputs, delivered throughputs and packet loss.
Test highlights: GWS tests found that the AT&T bundle performed the best when factoring in the combination of metrics tested. In terms of mean download throughputs, AT&T, Spectrum and Xfinity easily topped 125Mbps. However, for upload, AT&T had the fastest average combined speed (100Mbps), doubling the average speeds provided by the nearest competitor (Verizon at around 50Mbps). When it came to reliability, AT&T and Verizon scored the highest; both were above 99% with T-Mobile, Spectrum and Xfinity at or below 99%.
This report looked at US consumer experience and wireless network performance across mobile and broadband – following the consumer’s connectivity needs as they go about their daily activities.
Key takeaways:
Data Source for Performance Rankings, App Engagement Insights, and Consumer Sentiment: All data was collected from GWS’s opt-in consumer panel of just over 104,000 participants (aged 18+), making up a nationally representative sample of people from around the US. This is a panel of real-life users who use their phones and tablet devices as normal throughout the day; as a result, the data GWS gathered provides the most accurate picture of the nation’s connectivity experience. Data was anonymously collected from Android smartphones/tablets during the first six months of 2024 (January 1st through June 30th) and reported in aggregate for market research purposes only.
Performance Test Data (what was tested): GWS conducted a series of tests in the background, measuring and analyzing mobile and ISP broadband network performance involving download and upload available throughputs, delivered throughputs, FCC broadband benchmark (broadband testing only), latency, reliability, and packet loss. These metrics were then used to determine mobile operator and ISP scores in relation to the three awards. In total, GWS collected nearly 4 billion data points and conducted over 3.4 million tests during the six-month test period to determine the results. Tests were run at random times, seven days a week, on both mobile and WiFi networks. For the Best Combined Connectivity Experience Award, scoring was based only on tests from a mobile network and that operator’s broadband partner. For example, Spectrum Mobile test results from a Spectrum Mobile panelist were paired with Spectrum broadband test results from that panelist.
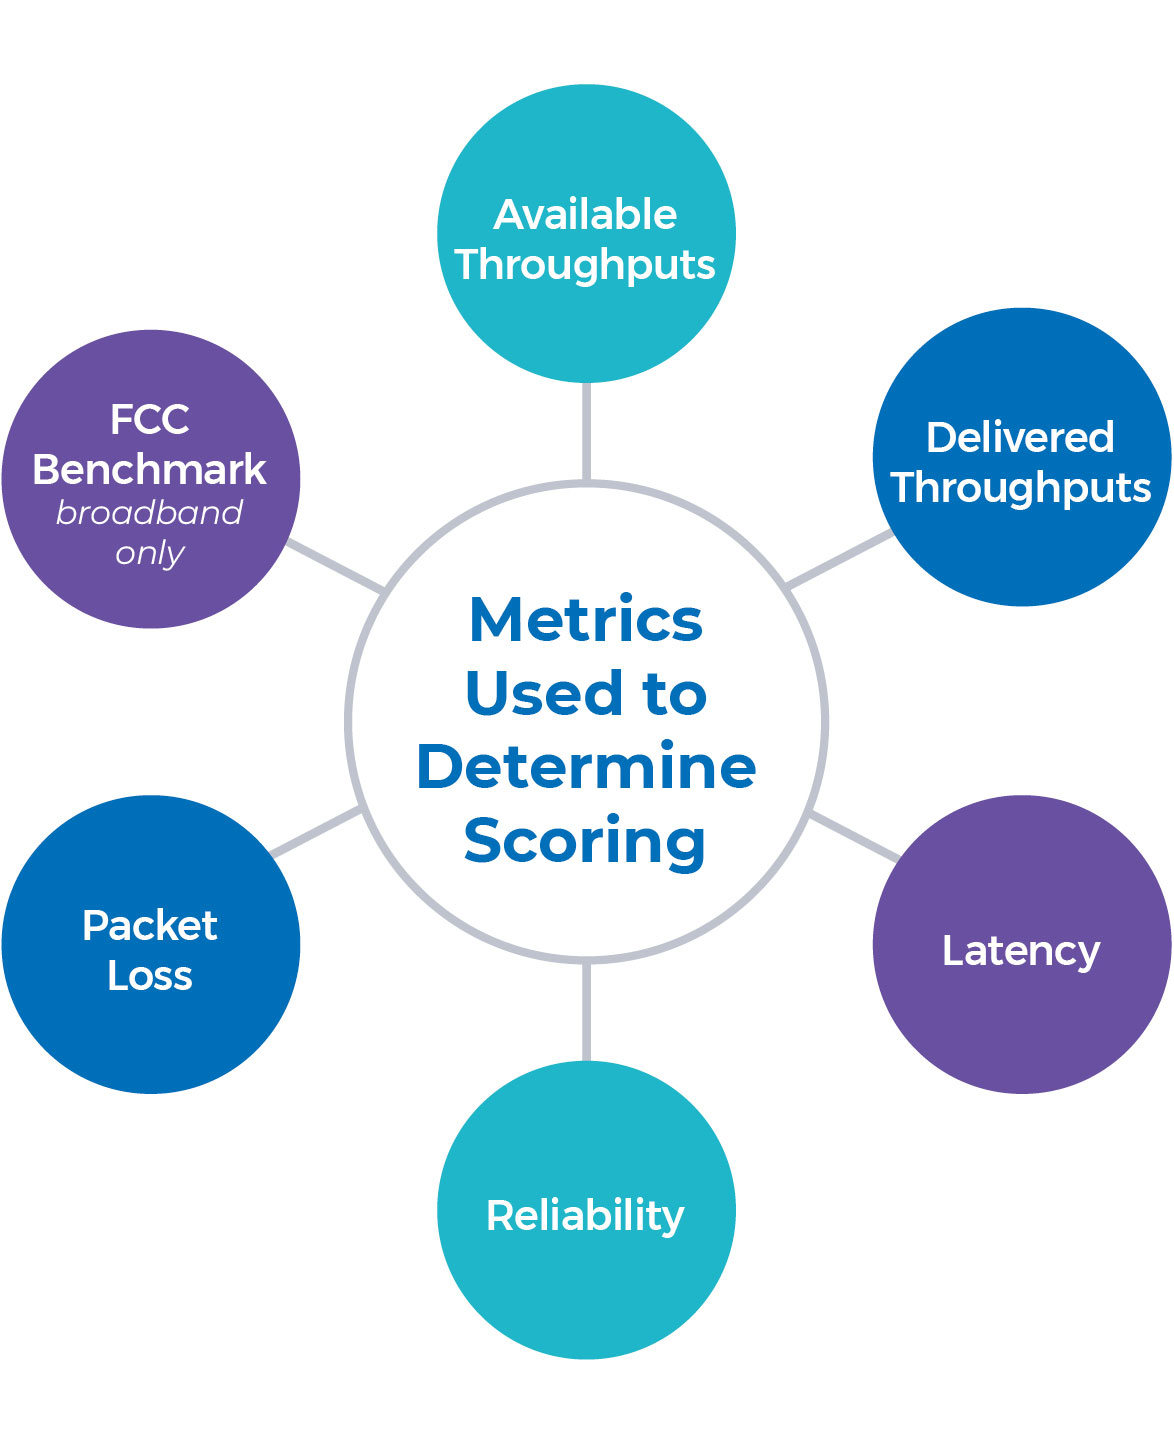
More about the metrics – what was measured:
OneScore Ranking Methodology (how the awards were determined): GWS’s patented ranking methodology takes into the test metrics mentioned above, and combines them into a single score that highlights the overall performance of each network. In addition, the importance of each metric is weighted based on feedback from consumers across the U.S.; feedback that focuses on those elements of network performance that matter most to everyday people.
Specifically, the results were normalized and weighted (based on consumer polling) to determine mobile operator and ISP scores in relation to the three awards (Best Mobile Experience, Best Broadband Experience, and Best Combined Connectivity Experience). In addition, scores were statistically tested to determine specific rankings.
App Engagement Data (how users engage with their apps): GWS collected app engagement data from user devices to understand how, when, and for what purposes consumers connect and use their apps. Data collected includes app usage, frequency of use, and other similar metrics. Data is weighted to be a demographic representation of the US adult population (18+).
Consumer Polling Data (consumer sentiment about what’s important to them): GWS conducted surveys to poll panelists about their network experience as it relates to their activities and expectations. All information collected was weighted to a user’s demographic representation of the US adult population (aged 18+).
For most consumers today, their smart device is their life’s remote control. As an independent wireless insights consulting firm, GWS measures every aspect of how people live, work, and play via their mobile devices – as well as how mobile network performance affects them.
Combining our market-leading network benchmarking technology and methodology with deep behavioral data, we help businesses and organizations drive innovation and deliver better customer experiences through wireless insights, anywhere in the world. Championing the needs of mobile and broadband users by understanding and testing the things that matter to them, we’ve evolved our technology and services in step with the needs of industry and consumers for 28 years.
Using Our Data: All information, test results, performance metrics, or awards provided in any GWS press release or report may not used by an entity for marketing or advertising purposes (including, for example, promotion via the entity’s website or social media channels or paid-for promotion such as, but not limited to, print, online, radio, TV, and social media) without prior approval from GWS. Email [email protected] for further details.
Using Our Data: All information, test results, performance metrics, or awards provided in any GWS press release or report may not used by an entity for marketing or advertising purposes (including, for example, promotion via the entity’s website or social media channels or paid-for promotion such as, but not limited to, print, online, radio, TV, and social media) without prior approval from GWS. Email [email protected] for further details.
| Cookie | Duration | Description |
|---|---|---|
| __utma | 2 years | This cookie is set by Google Analytics and is used to distinguish users and sessions. The cookie is created when the JavaScript library executes and there are no existing __utma cookies. The cookie is updated every time data is sent to Google Analytics. |
| __utmb | 30 minutes | Google Analytics sets this cookie, to determine new sessions/visits. __utmb cookie is created when the JavaScript library executes and there are no existing __utma cookies. It is updated every time data is sent to Google Analytics. |
| __utmc | session | The cookie is set by Google Analytics and is deleted when the user closes the browser. It is used to enable interoperability with urchin.js, which is an older version of Google Analytics and is used in conjunction with the __utmb cookie to determine new sessions/visits. |
| __utmt | 10 minutes | Google Analytics sets this cookie to inhibit request rate. |
| __utmz | 6 months | Google Analytics sets this cookie to store the traffic source or campaign by which the visitor reached the site. |
| hid | session | .prod-public-uswest-a.online.tableau.com |
| tableau_locale | session | public.tableau.com |
| tableau_public_negotiated_locale | session | public.tableau.com |
| VISITOR_INFO1_LIVE | 5 months 27 days | A cookie set by YouTube to measure bandwidth that determines whether the user gets the new or old player interface. |
| Cookie | Duration | Description |
|---|---|---|
| __utmb | 30 minutes | Google Analytics sets this cookie, to determine new sessions/visits. __utmb cookie is created when the JavaScript library executes and there are no existing __utma cookies. It is updated every time data is sent to Google Analytics. |
| __utmt | 10 minutes | Google Analytics sets this cookie to inhibit request rate. |
| __utmz | 6 months | Google Analytics sets this cookie to store the traffic source or campaign by which the visitor reached the site. |
| _ga | The _ga cookie, installed by Google Analytics, calculates visitor, session and campaign data and also keeps track of site usage for the site's analytics report. The cookie stores information anonymously and assigns a randomly generated number to recognize unique visitors. | |
| _ga_RNK4W8MKLP | 1 year | Google Analytics |
| CONSENT | 2 years | YouTube sets this cookie via embedded youtube-videos and registers anonymous statistical data. |
| Cookie | Duration | Description |
|---|---|---|
| YSC | session | YSC cookie is set by Youtube and is used to track the views of embedded videos on Youtube pages. |
| yt.innertube::nextId | never | This cookie, set by YouTube, registers a unique ID to store data on what videos from YouTube the user has seen. |
| yt.innertube::requests | never | This cookie, set by YouTube, registers a unique ID to store data on what videos from YouTube the user has seen. |